Introduction to eye-tracking
eye-tracking, experiments, saccadic latency, looking time, pupil dilation, fixations, infant research, DevStart, developmental science
Eye tracking is a great tool to study cognition. It is especially suitable for developmental studies, as infants and young children might have advanced cognitive abilities, but little chances to show them (they cannot talk!).
Across the following tutorials, we will go through you all you need to navigate the huge and often confusing eye-tracking world. First, we will introduce how an experimental design can (and should) be built. Then, we will explain how to implement the design in Python, connect it to an eye-tracker, and record eye-tracking data. Once the data is collected, we will focus on how to analyse the data, reducing the seemingly overwhelming amount of rows and columns in a few variables of interest (such as saccadic latency, looking time, or pupil dilation).
How to build an eye-tracking experiment
Before even staring to think about how our experimental paradigm will look, we must think about theories and hypotheses: What do we want to test? Only once the answer to this question is clear, we can think of the experimental paradigm to test our hypotheses.
Let’s imagine we would want to investigate the mechanisms underlying infants’ curiosity. Current theories of curiosity argue that more attention is allocated towards stimuli that offer greater learning opportunities (Gottlieb & Oudeyer, 2018; Poli et al., 2024). We might want to test whether this is indeed the case starting from infancy. More specifically, our hypothesis could be that infants should be more motivated to predict when and where a target stimulus will appear if such stimulus offers a greater learning opportunity.
This particular research question about curiosity and learning is what we are interested in, and thus why we chose it as our example throughout these tutorials. However, many other experimental designs and research ideas would work equally well for demonstrating eye-tracking principles!
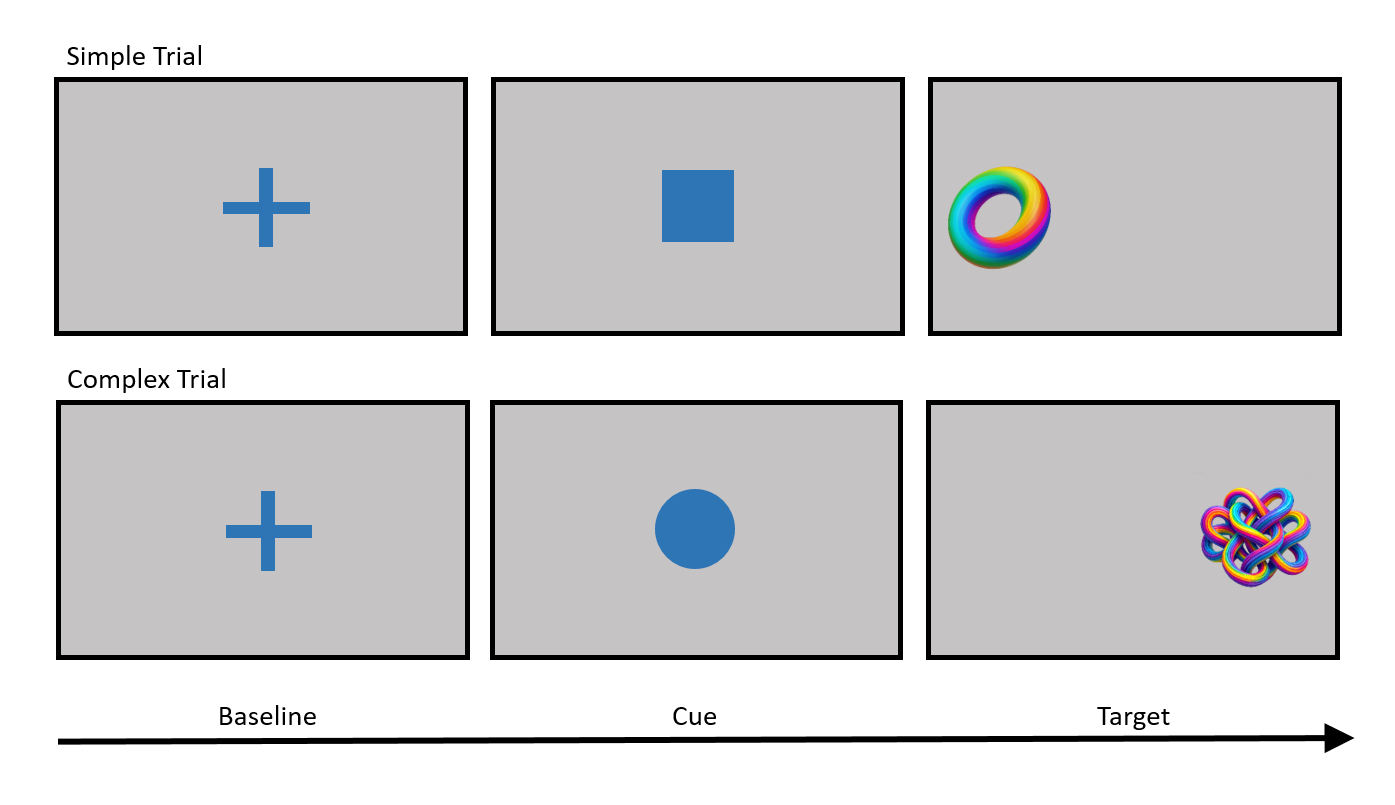
To test this, we devised a very simple paradigm in which two cue stimuli (either a circle or a square) reliably predict the location of the following target stimulus (either on the right or on the left, respectively). Crucially, we will manipulate how much they can learn from these two target stimuli. The stimulus associated with the circle will be visually complex, and it will thus offer many components which infants can slowly unpack and learn about. The stimulus associated with the square will be visually simple, and it will thus offer very little to learn. The exact paradigm is illustrated below. Please not that we generated a very simple paradigm for educational purposes, and this is thus not fit for a robust, fully-fledged experimental inquiry.
It is much easier to start an eye-tracking project if you have a clear idea of what is your measure of interest. At the same time, what measure of interest you choose really depends on what cognitive process you are trying to study. Here we review some eye-tracking variables which have been key in the field of (developmental) cognitive science, and what cognitive processes they might relate to. However, it is very important to notice that ultimately, no measure is perfectly related to any cognitive function. The same measure can be related to many different cognitive processes depending on the specific experimental paradigm we are using.
What do you want to measure?
Great, we have a theory (Curiosity is a drive to learn) and a specific hypothesis to test it (When stimuli offer a learning opportunity, infants should be more motivated to predict where they will appear). Now we need specific metrics which will allow us to test our hypotheses.
First of all, we should have some measure that actually checks whether infants spend more time engaging with a complex stimulus vs a simple one. For this, we might use the looking time to the stimuli.
If this “background check” is passed, and infants actually engage more with the complex stimuli, we might then try to find a more direct answer to our hypothesis: Will they be more motivated to predict where the complex stimulus will appear? This hypothesis can be broken into two components: We have a learning component (predict where the stimulus will appear) and a motivational component (more motivated to do so). For these two components, we might need different measures.
For the learning component, we can rely on saccadic latency. Saccadic latency measures the speed at which infants look at the target stimulus once it is presented. When infants learn the location of a stimulus, they become faster and faster at predicting it. Sometimes, they might even look at its location before the stimulus appears! This would be a correct prediction, which is indicative of successful learning.
For the motivational component, we could use pupil size. Pupil size measures many different things, including arousal. If a stimulus is more engaging, arousal should increase. In this specific case, we might observe greater pupil size in trials with complex stimuli. Pupil size is a complicated measure to use, so for now we will not get into more details. Let’s just agree that pupil is great to understanding not only learning, but also motivation.
This example paradigm allows us to understand how to start from general theories, make testable hypotheses, and finally narrow down how these hypotheses can be tested empirically. In our case, given our hypotheses and what kind of measures might allow us to test them, eye-tracking seems to be perfect for us! It would allow us to simply collect gaze and pupil data, which underlie all the metrics we mentioned above. Remember, usually we start from the theory and hypotheses, and then we pick the method (for example eye-tracking, EEG, fNIRS, and so on) that would be the most helpful in testing our hypotheses, and not the other way around!
Looking time
We saw how looking time could be a good measure of interest in a stimulus, but what exactly looking time measures depends on the experimental paradigm. Classic paradigms on infant research, such as Habituation and Violation of Expectations, rely on looking time as main measure.
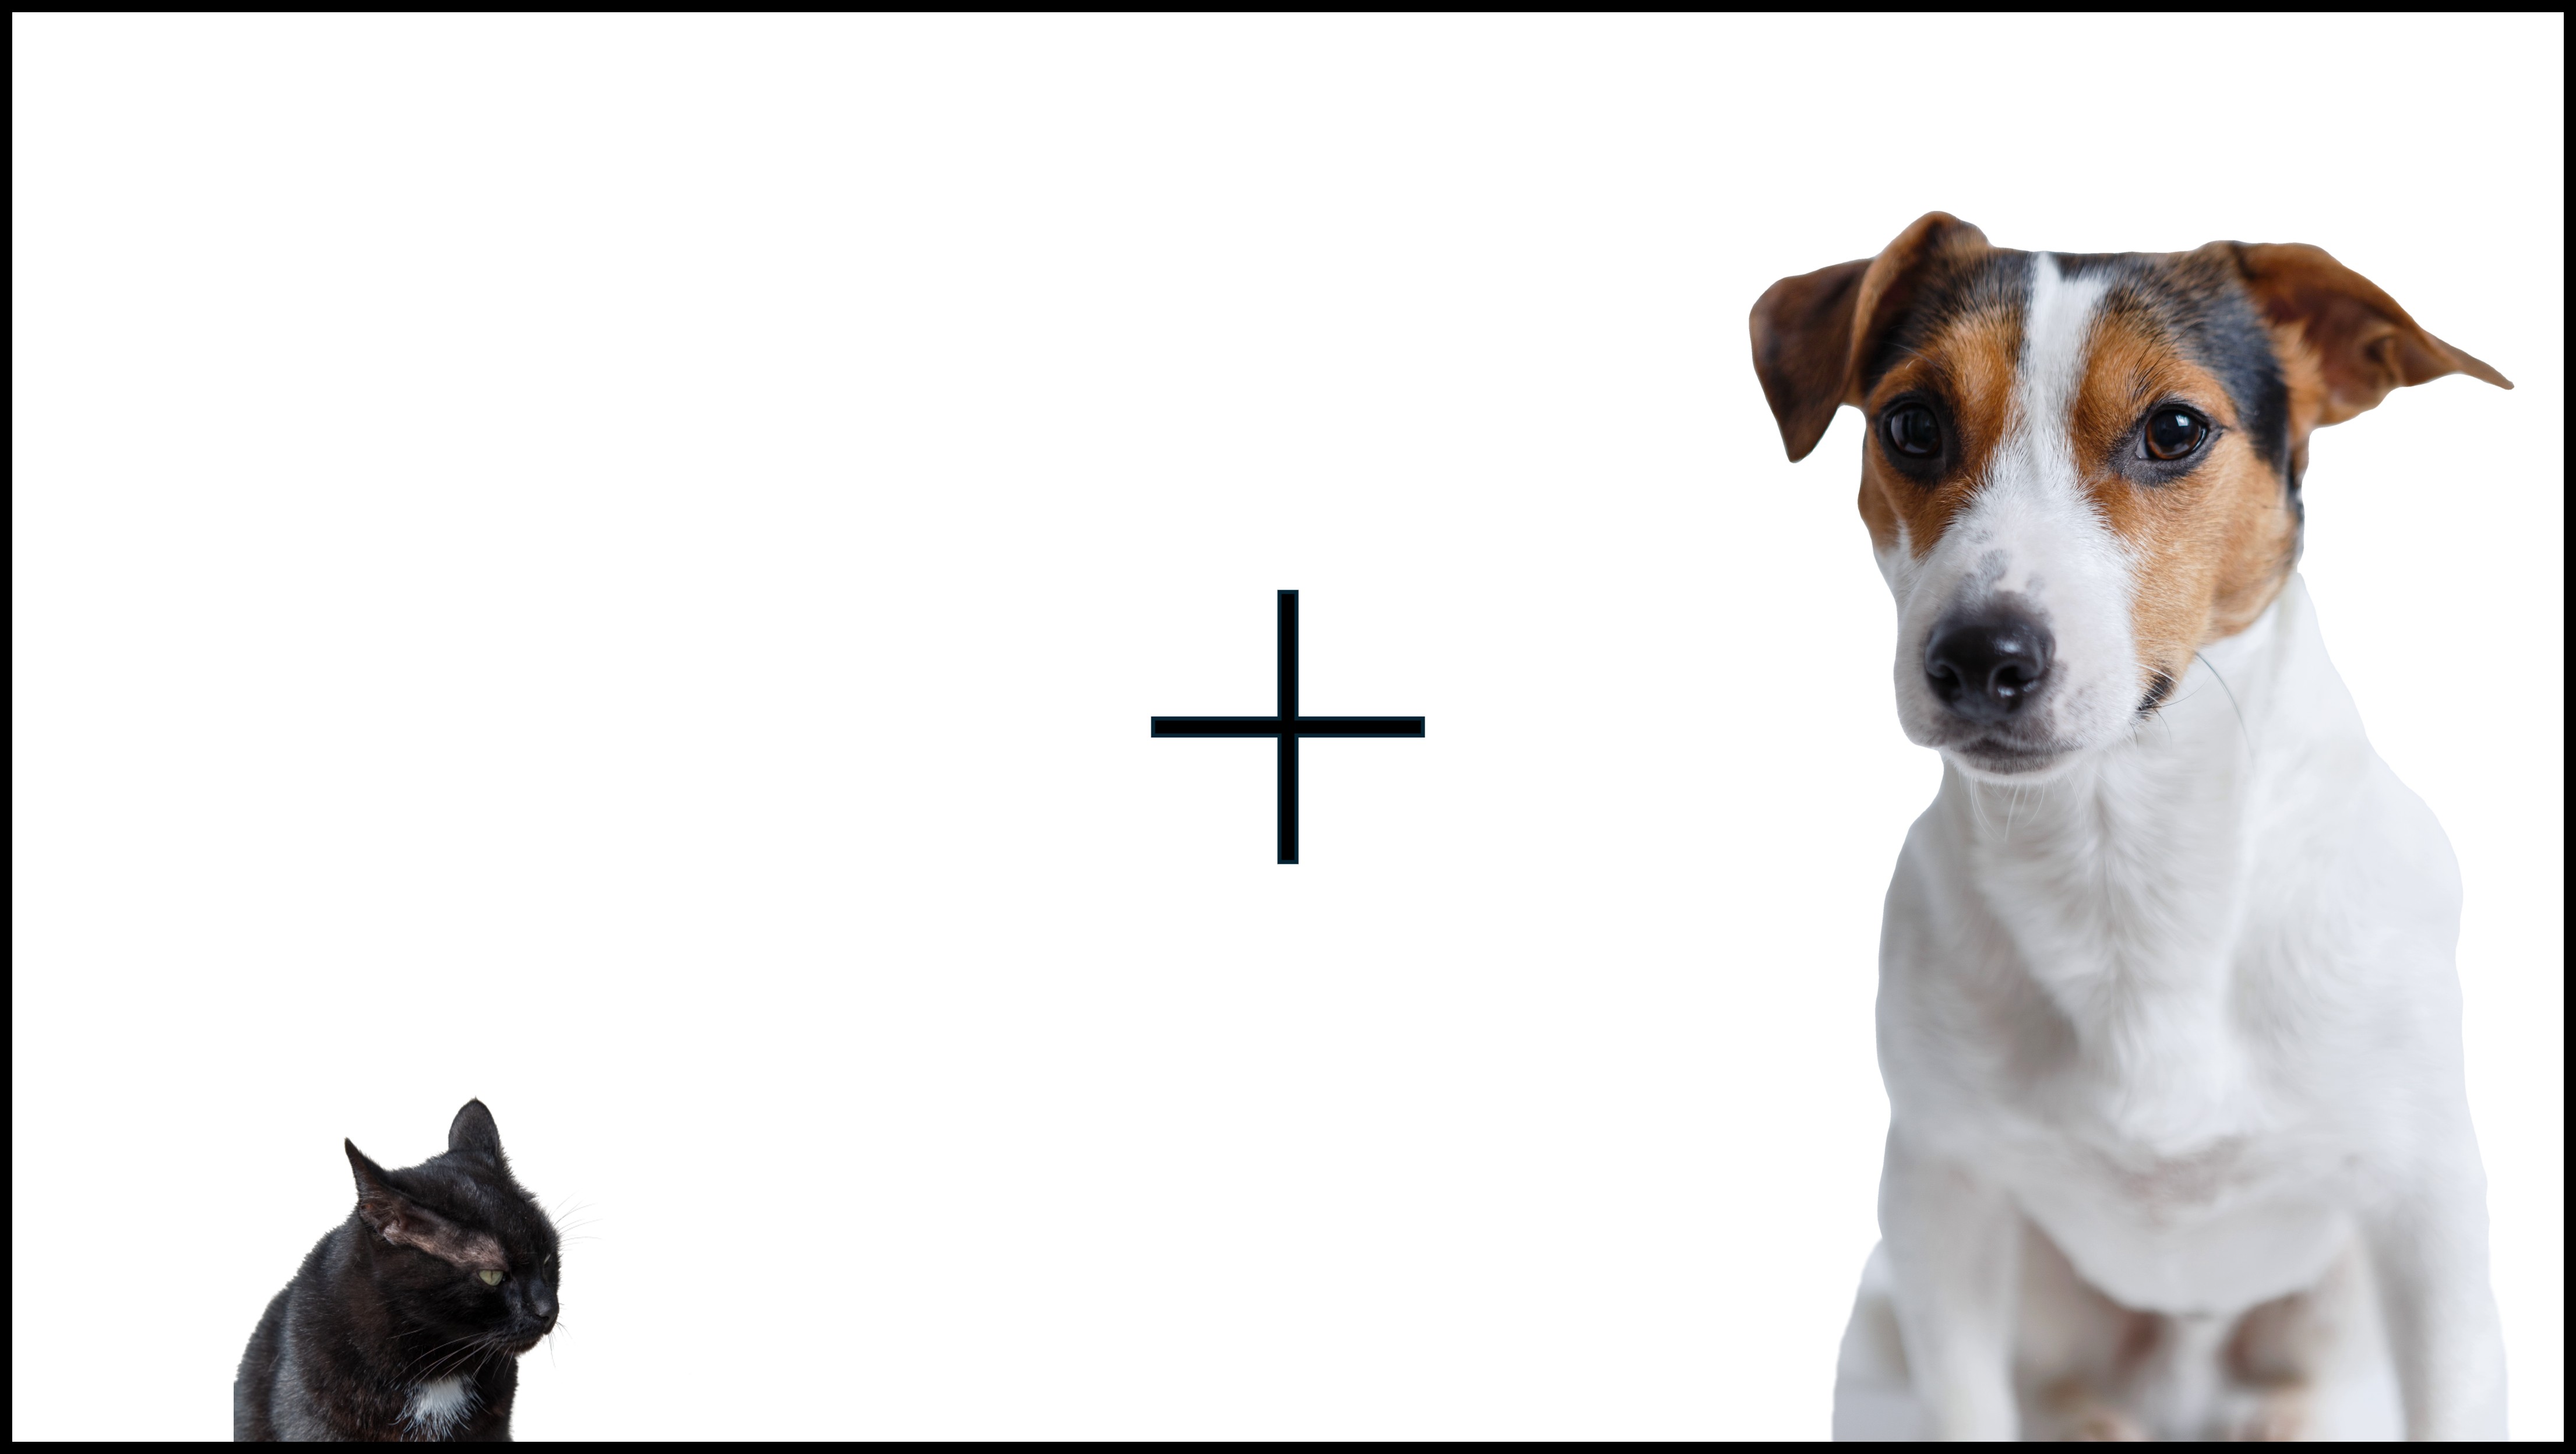
In Habituation paradigms, infants are presented with the same stimulus (e.g. a cat) over and over again. Usually, the looking time to the stimulus decreases across repeated presentations. The number of repeated presentations can be fixed (e.g., 10 for all infants) or dependent on the infant looking (e.g., when looking time to the last 3 stimulus presentations combined has fallen by 50% compared to the first three stimulus presentations). Afterwards, a different stimulus is presented (e.g., a dog). If infants have no ability to discriminate cats from dogs, they will not notice the change and will look at the new stimulus the same amount, or even less. If, however, infants can discriminate cats from dogs, they will be more interested in the new stimulus, and will look longer at the dog. Habituation can be helpful to understand what kind of internal representations infants already have, and which ones still need to develop.
In the example above, we can conclude that infants can distinguish dogs from cats only if we control for many alternative explanations and chose the stimuli carefully. In reality, all we know with habituation paradigms is whether infants can spot any difference between the images. If for example the dog image is bigger, or it has different colors, it might be that infants are reacting to changes in size or color rather than animal category! Always chose your stimuli carefully.
Can you spot the problem here?😁
Another common paradigm using looking time is the Violation of Expectations paradigm. Here the underlying logic is a bit different from the Habituation paradigm: Infants might be presented with an expected event (a ball falling) or an unexpected event (a ball floating in mid air). If infants’ expectations are violated, they will be surprised, which will lead to an increase in looking time.
You can already see how changing the paradigm changes what looking time measures: Novelty detection in the first case, surprise in the second. However, more broadly, we (and infants) tend to look more at something if we care more about it. In more scientific terms, what we observe is the focus of our “overt” attention, and receives preferential processing. What exactly attracts our overt attention might then depend on the paradigm (a more novel item, a more surprising one, a scarier one even).
With looking time, we can conclude that infants decided to allocate more attention at something, but not why! Was it because the stimulus newer? More surprising? Scarier? More soothing? Be careful about what kind of conclusions you draw when you observe a difference in looking times between different stimuli or conditions!
Saccadic Latency
Another very popular eye-tracking measure is saccadic latency. It measures how quickly infants can direct their gaze onto a stimulus or event. For example, infants might be presented with the video of a person grabbing a mug and bringing it to their mouth (predictable event) or their ear (unpredictable event). The key event we are interested in is the moment the mug makes contact with the body of the person (either the mouth or the ear). If infants have learned that mugs are usually brought to the mouth, they will quickly direct their gaze (saccade) towards the person’s mouth, irrespective of the type of event (predictable vs unpredictable). If infants cannot make this prediction yet, they will wait to see where the mug goes before making a saccade. When saccadic latency is so fast that it occurs before the event (that is, the mug touching the body), the resulting look (also called fixation) is called anticipatory look.
Infants (just like adults) are trying to predict what will happen next all the time. By looking at the speed of saccadic latencies, we can get an insight onto what their predictions are (where did they look?) and how strong the predictions are (how quickly did they look?).
While anticipatory looks give us a window on what infants prediction are, they are not always reliable. For example, a very cool study has found that infants make predictions when the outcome is probabilistic but not when it is deterministic. Keep this in mind when planning your next study!
In our new experimental paradigm about infant curiosity, stimuli are presented over and over in two locations (the simple stimulus on the left, the complex one on the right). Here, we expect infants to get faster and faster at looking at the stimuli (that is, saccadic latencies will get shorter and shorter). For example, at the beginning infants might look at the stimuli +500 milliseconds after they have been presented. As they learn, saccadic latency might reduce (for example, to +100 milliseconds) even to the point that they happen before the stimulus is presented (-200 milliseconds). While the last example is clearly an anticipatory look (they looked before the stimulus was even there!), here’s something that might come as a surprise: the second example (+100 milliseconds) is also an anticipatory look! This might seem counterintuitive at first—how can looking after something appears be anticipatory? But when we think more about it, here’s what’s happening: it takes around 200 milliseconds for adults to plan a saccade (and even more for infants!), so if a saccade happens at +100 milliseconds after stimulus presentation, the brain actually started planning it 200 milliseconds before that—which means at -100 milliseconds, before the stimulus even appeared. This one is also anticipatory!
Saccadic latencies are not a perfect measure of learning. Infants might be faster at looking at something just because they are more interested (pick interesting stimuli to keep them engaged!), and they might become slower due to boredom or fatigue (have some variation in the stimuli, so that they do not get as boring over time!).
Pupillometry
Most eye-trackers do not only track the position of the eyes on the screen (gaze data) but also the size of the pupil. In our opinion, pupil size is the most fascinating, the coolest, and possibly the most misunderstood eye-tracking measure. Pupil size changes depending on the light (it gets smaller when light is more intense) to help us see better. However, it changes more subtly also depending on cognitive processes. When lighting conditions are kept stable, it is much easier to catch these subtler processes.
The fact that changes in pupil size due to cognitive processes are subtler than overall changes due to light has led to the common misconception that pupil data are noisy and unreliable. However, pupil size is a measure with a high signal to noise ratio. This means that if we do everything right, we can get really good data with very little noise. In our experience, pupil size is usually more reliable than gaze data (looking time, saccadic latency, and so on), but it requires some additional thought both in building the experimental paradigm and in processing the data. But don’t worry, our tutorials will guide you through everything!
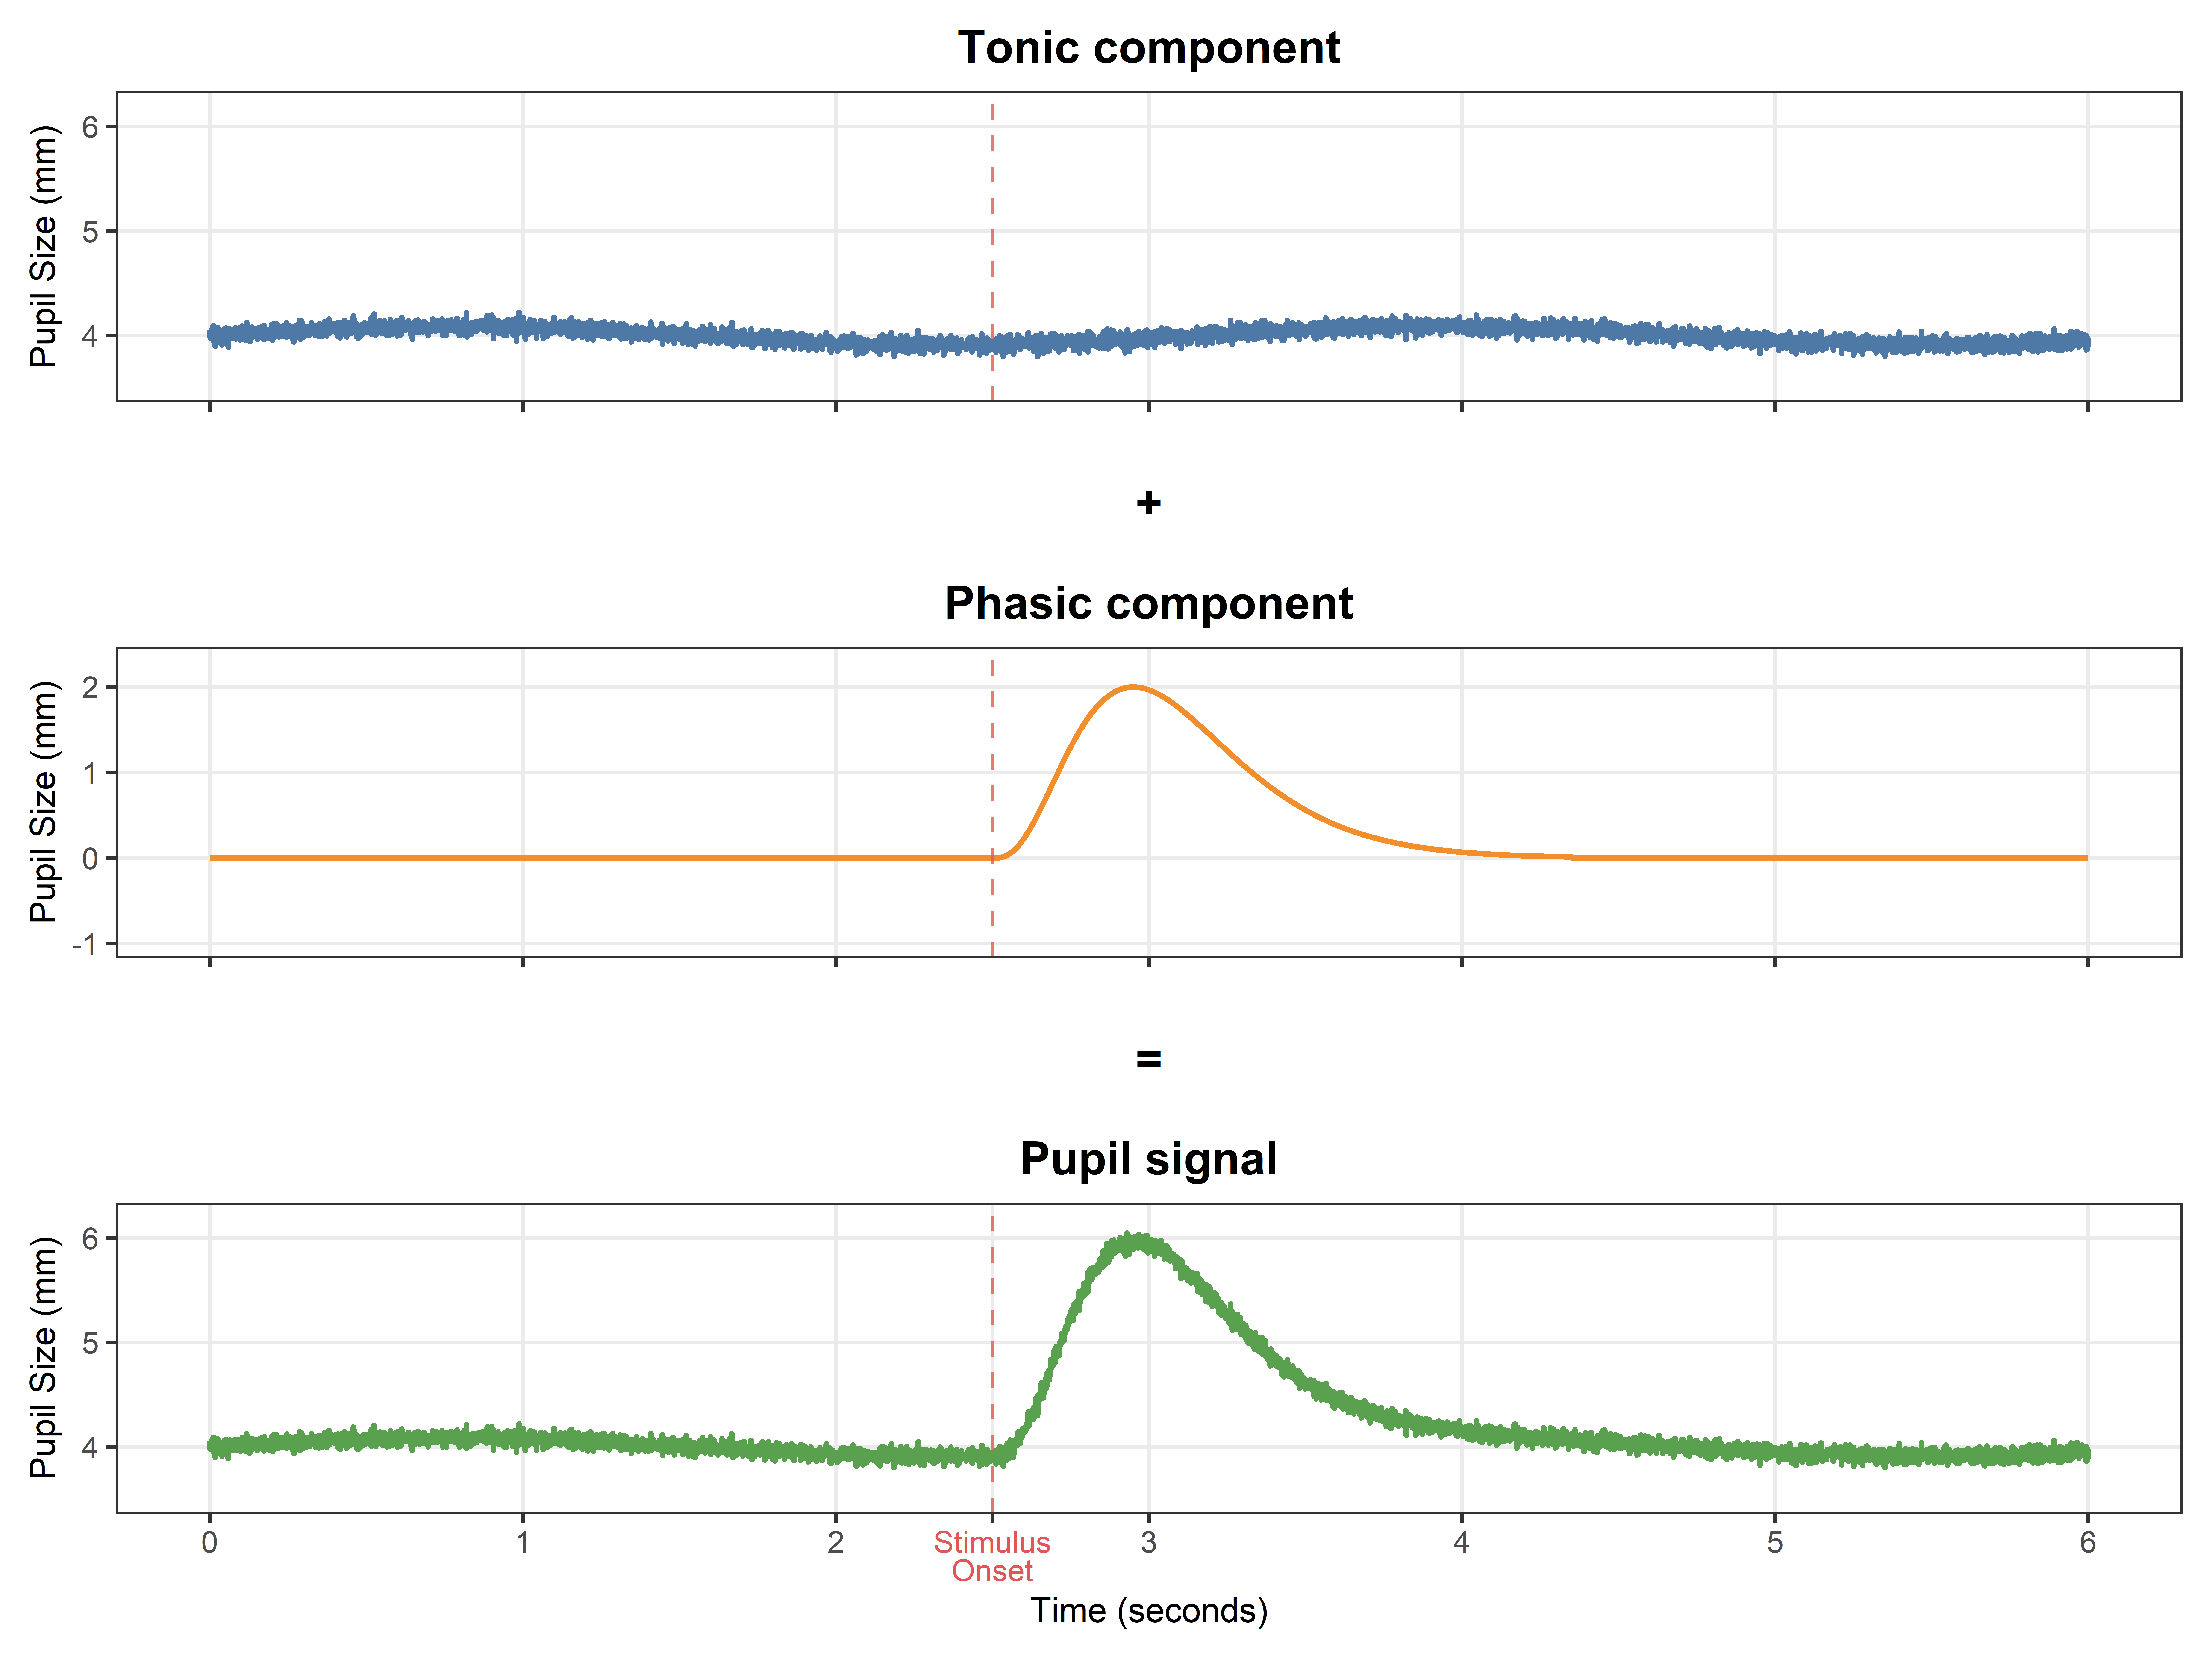
So, what does pupil size measure? Again, it depends on the task. Generally speaking, we have to make the distinction between tonic pupil size and phasic pupil dilation, because they measure different things. Tonic pupil size is simply the size of the pupil at any moment in time - even better if measured when nothing much is happening on the screen. Phasic pupil dilation is a sudden change in pupil size due to the presentation of a certain stimulus or event.
Greater tonic pupil size has been associated with heightened arousal. Again, many things might impact arousal (how interesting, scary, difficult or uncertain a stimulus or situation is). In contrast, phasic or transient pupil responses to task-relevant unexpected events are more specifically linked to prediction-error processing and the subsequent updating of internal beliefs.
Here an image that tries to show you the different components of the pupil dilation and how they are part of the pupil signal
Tonic and phasic pupil signals map onto the tonic and phasic firing modes of the locus coeruleus, which are thought to regulate sustained arousal and vigilance (tonic mode) and rapid, event-driven shifts in attention or learning (phasic mode) through noradrenergic transmission. So the neural correlates of pupillometry are surprisingly clear!
Earlier on, we said pupil data are really good if we do everything right. One thing we have to do right is to think through how to create stimuli that keep the luminance constant across conditions, otherwise we might observe differences in pupil size due to changes in light rather than due to our experimental conditions. For this reason, in our curiosity paradigm we decided to have two cue stimuli (circle and square) with exactly the same area. The preceding fixation cross also has the same area! So we are good to go!
Control stimulus properties: Present all stimuli of interest in the same location on the screen, as pupil size changes depending on screen location (it gets smaller away from the centre).
Allow sufficient time: Even phasic changes in pupil size, which are the fast ones, are still relatively slow (1-3 seconds), so trials have to be a little slower to give the pupil its time to shine.
Include baseline periods: Often, a fixation cross has to precede the moment in which pupil dilation is measured, so that pupil size can return to baseline before the event you care about happens.
With all these things in mind, and by having a look at other examples, good luck with using this super cool measure!
Recap
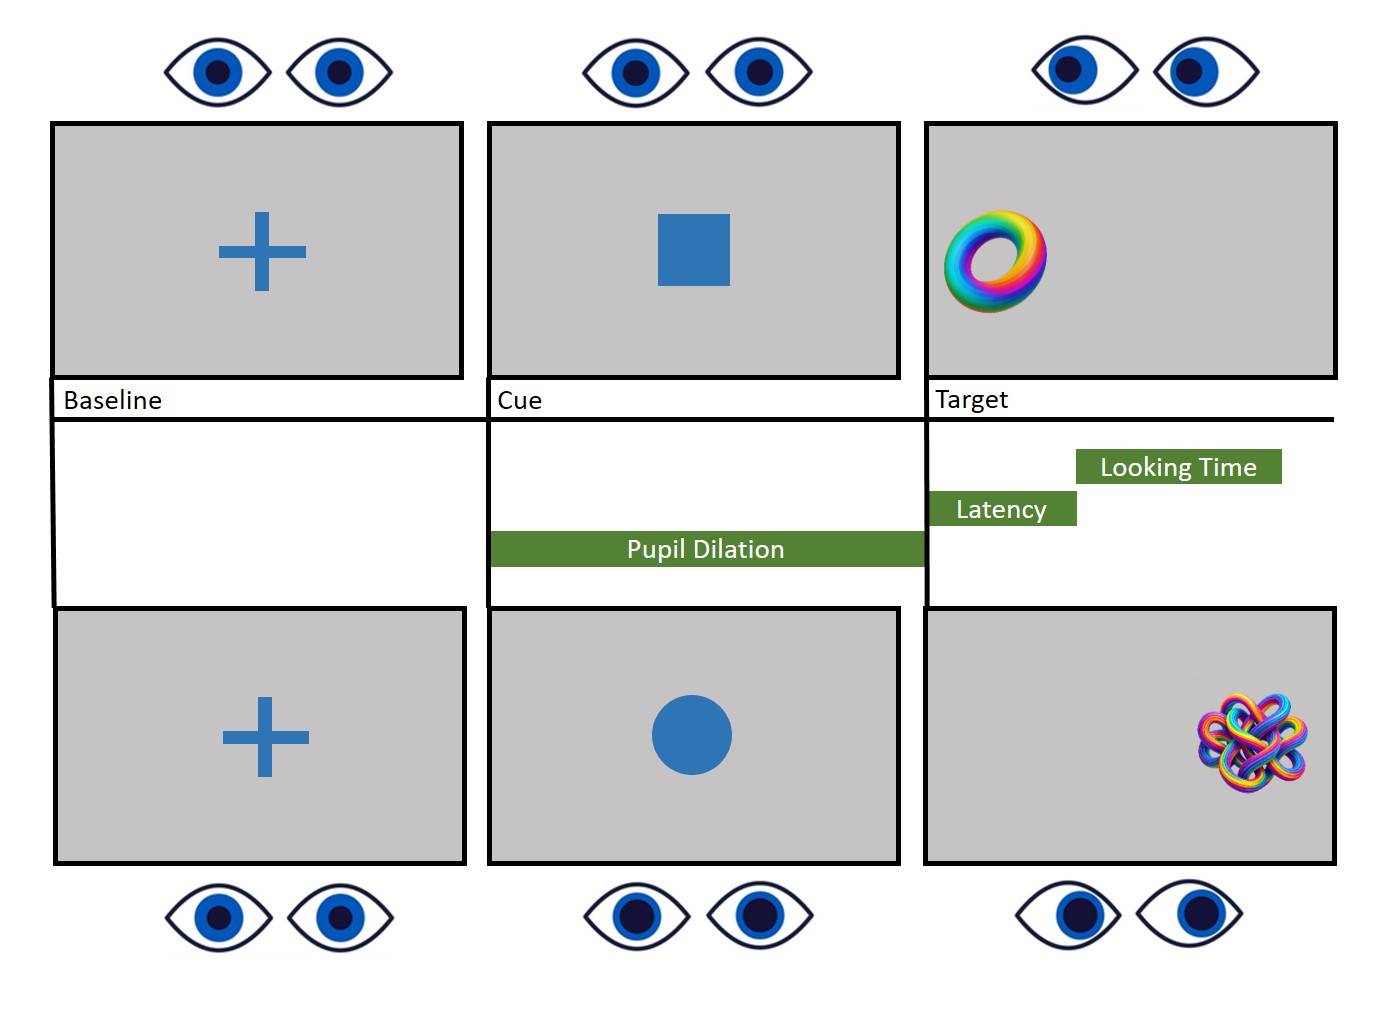
Below you can find a visual summary of some of the things you can measure using eye-tracking. These are the main measures we will be focusing on, but there are many more. We hope that by doing the tutorials, you will not only acquire the tools to collect and process these data, but you will get a solid conceptual and practical understanding. This way, you will be able to take our examples, modify them, build on them, and get out of the data all the measures you want!


